

Introduction
Sensor Dashboard is a development tool that visualizes real-time sensor data from Android Wear devices, giving developers and engineers a fast and direct way to inspect accelerometer, gyroscope, heart rate and other wearable sensors while testing on actual hardware. Sensor Dashboard focuses on live streams and clear presentation of both raw and processed sensor outputs so you can observe behavior in real-world conditions and iterate quickly on algorithms, filters, or data collection strategies.
What Sensor Dashboard does
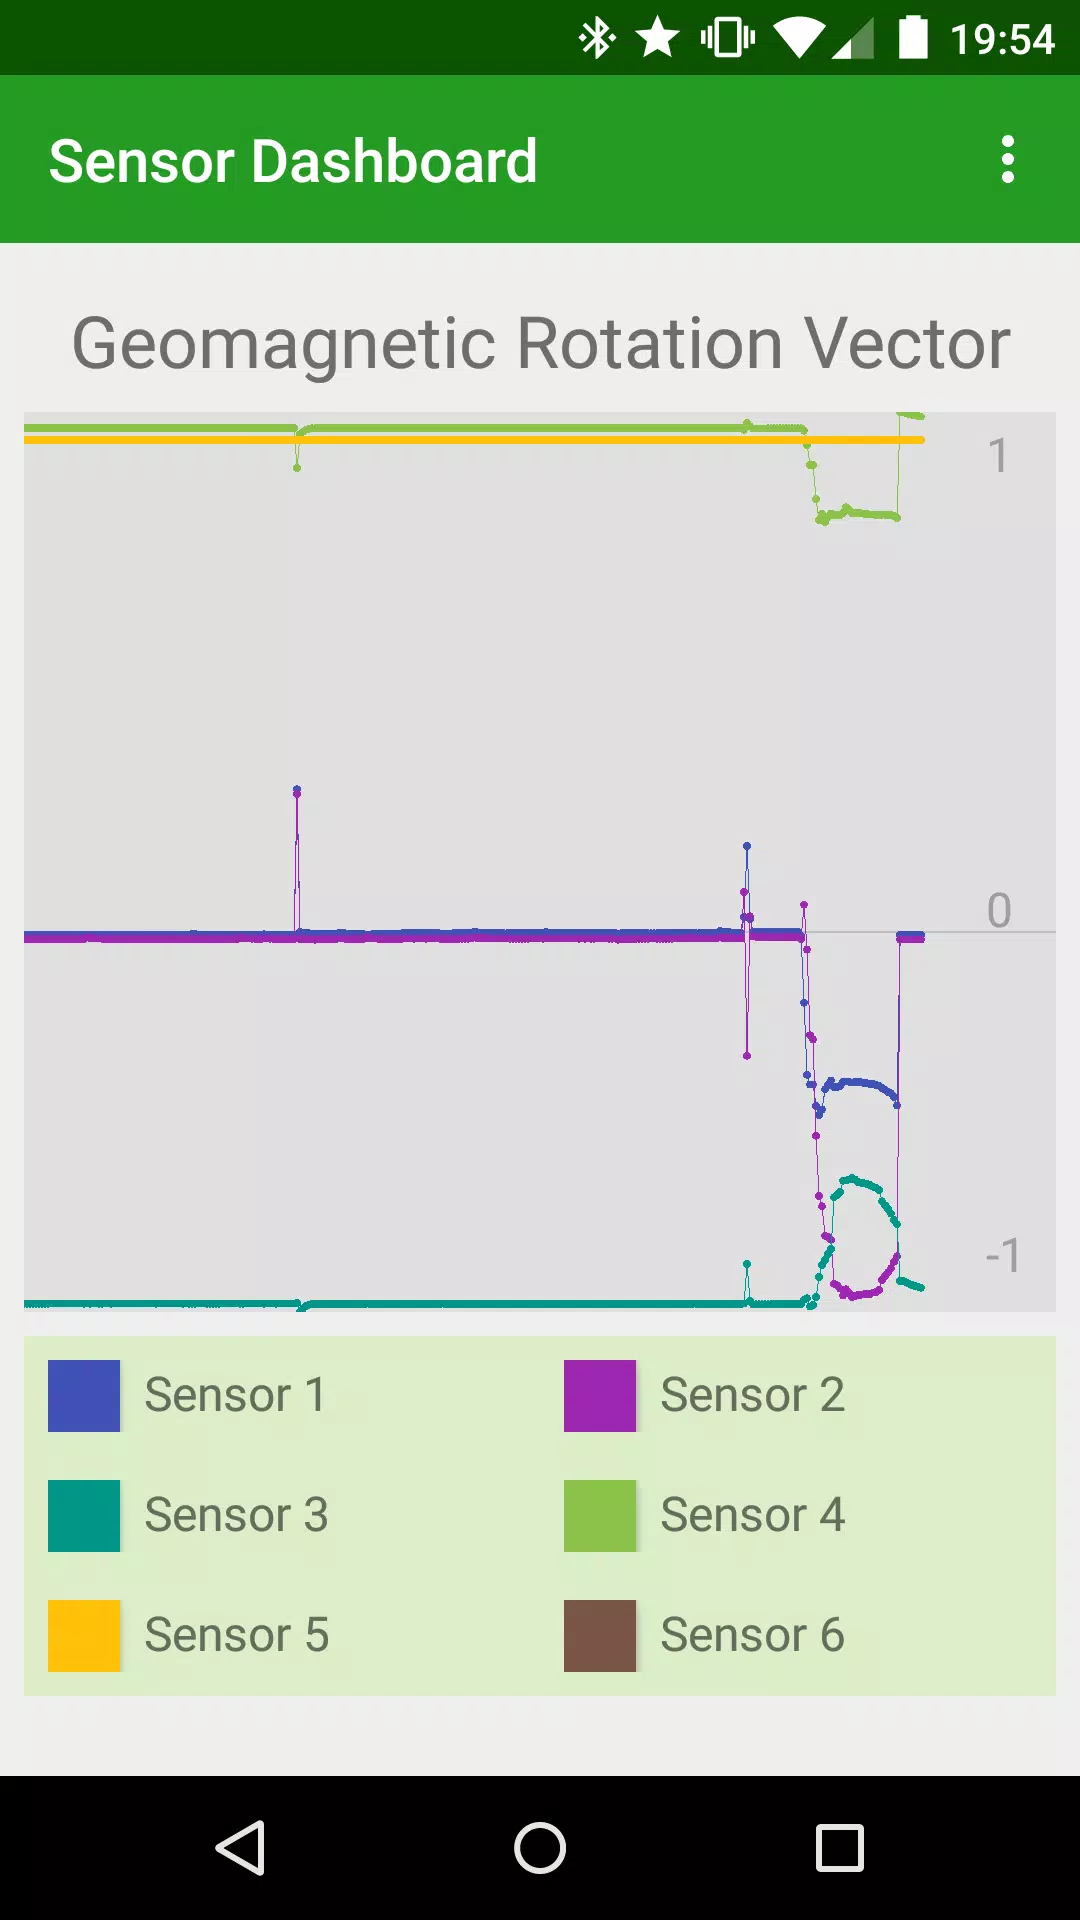
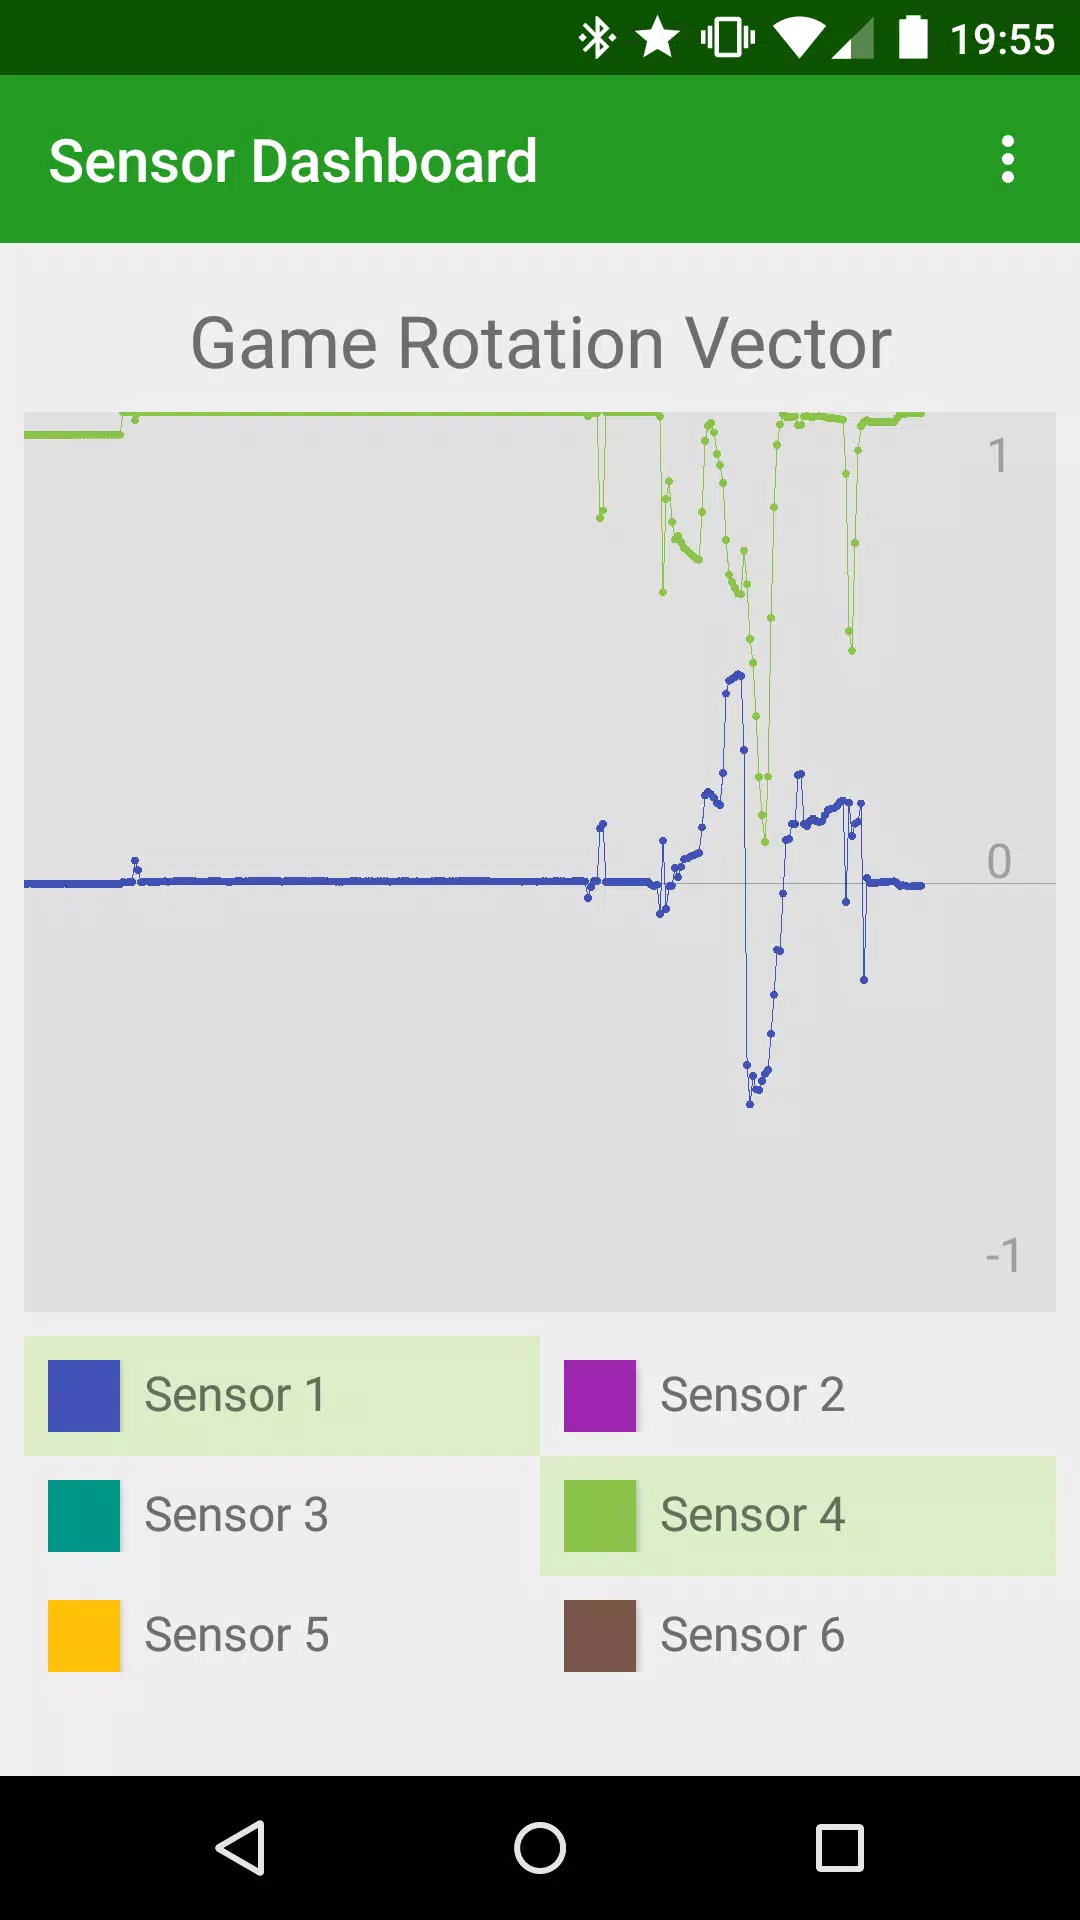
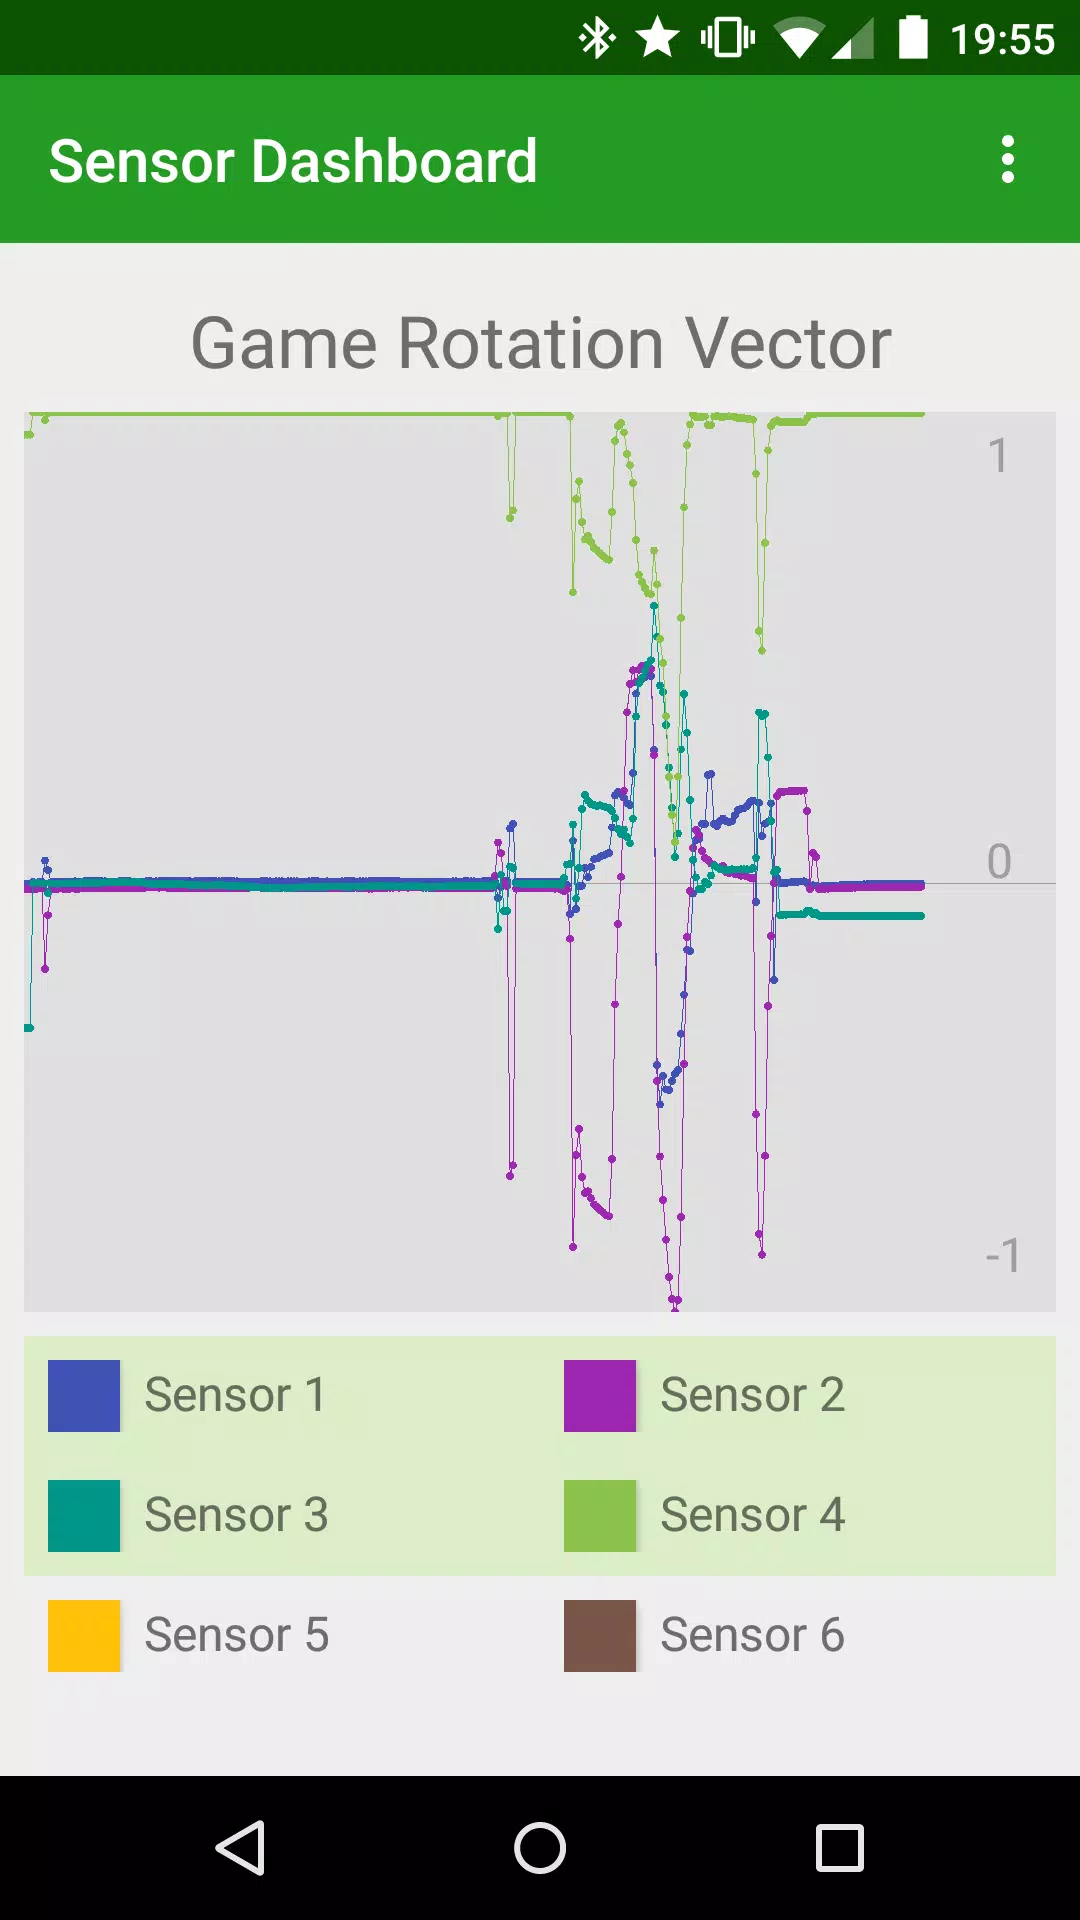
At its core, Sensor Dashboard captures live sensor feeds from Android Wear and renders them in an uncluttered view designed for small, wearable screens. The app shows time-series traces, numeric readouts and simple processing indicators (for example, filtered values or fused orientation estimates) so you can see how sensor data changes as a device moves or a person exercises. Because Sensor Dashboard is intended for technical workflows, it emphasizes fidelity and transparency over consumer-facing polish: values are presented without hidden smoothing so you can trust what you are debugging.
Controls and user interaction
Sensor Dashboard uses straightforward controls that suit wearable hardware: taps and swipe gestures let you switch between sensor panels, long-press or double-tap actions reset or pause streams, and a compact menu exposes configuration options such as sampling rate, sensor selection and display units. The interface minimizes distraction: each sensor panel can be opened full-screen for close inspection and closed quickly to compare multiple sensors. These controls are optimized for touch and minimal button interaction on Android Wear watches.
Visualization and visual style
The visual style in Sensor Dashboard is functional and contrast-driven to remain legible on small circular or square watch faces. Color-coding is used consistently across graphs to represent sensor axes and processed channels, and graph scaling adapts to recent data ranges so transient spikes remain visible. Fonts, line weights and axis labels are chosen for readability at glance distances, which helps when testing movements or capturing short bursts of activity on a wrist-worn device.
Progression, testing workflows and replay value
While Sensor Dashboard is not a game, it supports progressive testing workflows: you can start with baseline checks, increase sensor sampling for stress tests, and add filters or fusion logic to observe differences in real time. The app encourages iteration by making it easy to reproduce conditions: repeat a test sequence, compare before-and-after tuning, and validate outcomes on-device. That repeatable workflow gives the tool strong replay value for development cycles where incremental tuning and regression checks are routine.
Data handling, logging and extensibility
Sensor Dashboard is openly developed so teams can adapt logging behavior to their needs. The public source code includes examples showing how to capture sessions, add custom logging hooks and integrate with development pipelines; developers can extend the tool to add exports, custom processing, or new sensor visualizations based on those examples. Built to be lightweight, the app performs local data capture during sessions and leaves decisions about long-term storage and export to the integrator, which keeps the core package simple and focused.
Accessibility and device support
The app supports common accessibility needs by using high-contrast visuals and scalable text sizes appropriate for wearable screens, and the compact layout reduces cognitive load during quick checks. Sensor Dashboard is targeted at Android Wear hardware; it assumes a developer or tester can connect a watch and accept developer options. It is not intended for non-wearable platforms, and it expects users to have basic familiarity with sensors—nomenclature like accelerometer axes and sampling rates are not simplified into consumer language.
Typical use cases
Common scenarios for Sensor Dashboard include validating accelerometer and gyroscope calibration after hardware changes, confirming heart rate reading stability under motion, comparing raw versus filtered outputs while tuning algorithms, and running short field tests where immediate visual feedback accelerates debugging. Because Sensor Dashboard surfaces low-level behavior clearly, it is especially useful when logs alone are insufficient to reveal timing or transient issues.
Limitations and target audience
Sensor Dashboard is intentionally specialized: it is limited to wearable devices running Android Wear and is designed for developers, engineers and testers rather than general consumers. Interpreting raw and processed sensor outputs requires some technical background in sensor concepts and signal processing; users unfamiliar with those topics may need documentation or collaboration with a teammate to make full use of the tool.
Getting started and contribution
To get started, install Sensor Dashboard on a target Android Wear device, enable developer options as needed, and open the app to begin viewing live sensor streams. Because the project is open-source, contributors can add panels, adjust visualization styles, or incorporate custom logging examples to match their workflows. The approach keeps the core small while allowing teams to tailor the app to the particular sensors and test scenarios they care about.
- No virus
- No advertising
- User protection
Information
- File size: 6.40 M
- Language: English
- Latest Version: 1.1.1
- Requirements: Android
- Votes: 305
- Package ID: com.github.pocmo.sensordashboard
- Developer: Juhani Lehtimaeki
Screenshots
















Explore More
Explore an immersive world of entertainment with our media software. Watch, listen, and engage with your favorite shows, music, movies, and more. Access exclusive content, personalized recommendations, and innovative formats. Enhance your experience with our suite of cutting-edge applications. Discover hidden gems tailored to your unique tastes. Create, share, and connect over personalized playlists, reviews, and forums.
View more